The green shades denotes RH in excess of 70, 80 and 90%. The magenta dashed lines are the isobars.


This is the cross section along the gray line on the first chart. It might be tempting to suggest the cloud band originated from the vortex near 8°N 100°E (near "5" on the cross section, but looks like they are not related... or are they?
The flow is actually sloping upwards with constant theta_e rather than isentrops: you would imagine this would be the case since the air is saturated. Should I draw constant theta_e charts as well? Btw, constant theta lines are called isentrops; what's the name for constant theta_e lines, anyone?

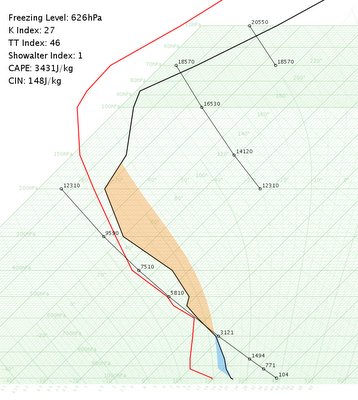
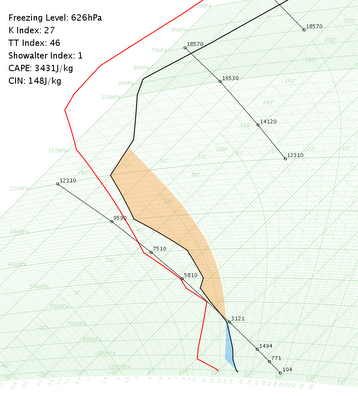
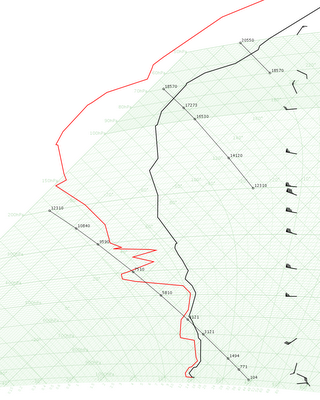
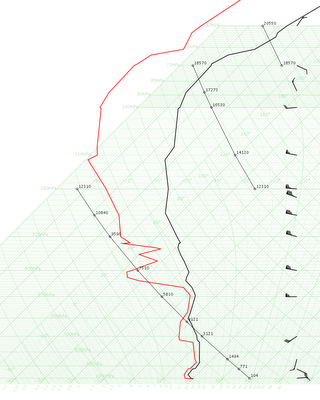
Corresponding Tephigram at Hong Kong. Gloomy rainy weather with low cloud base and visbility is a near certainty!


